Description
This method plots a histogram or QQ-plot of p-valuesfor all tests performed by Matrix_eQTL_engine.
Usage
## S3 method for class 'MatrixEQTL'
plot(x, cex = 0.5, pch = 19, xlim = NULL, ylim = NULL,...)
Arguments
x | An object returned by |
cex | A numerical value giving the amount by which plotting text and symbols should be magnified relative to the default. |
pch | Plotting "character", i.e., symbol to use. See |
xlim | Set the range of the horisontal axis. |
ylim | Set the range of the vertical axis. |
... | further graphical parameters passed to |
Details
The plot type (histogram vs. QQ-plot) is determined by the pvalue.hist parameter in the call of Matrix_eQTL_engine function.
Value
The method does not return any value.
Note
The sample code below produces figures like these:
Histogram: 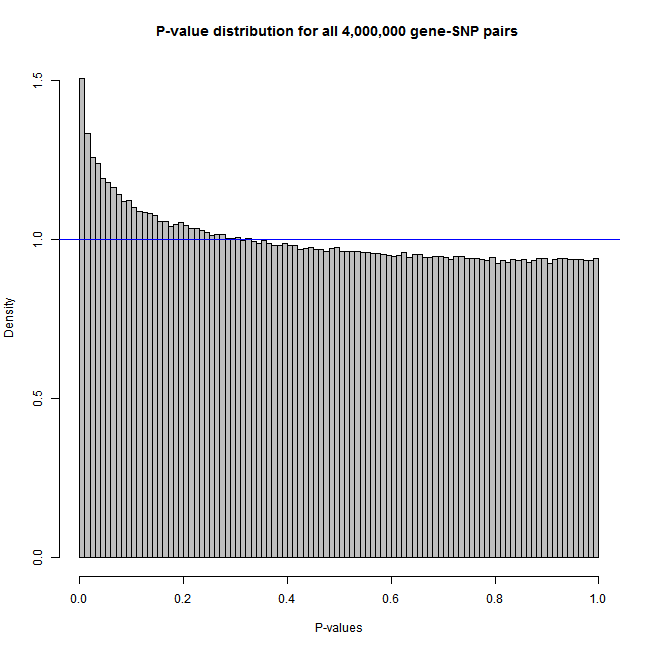
QQ-plot: 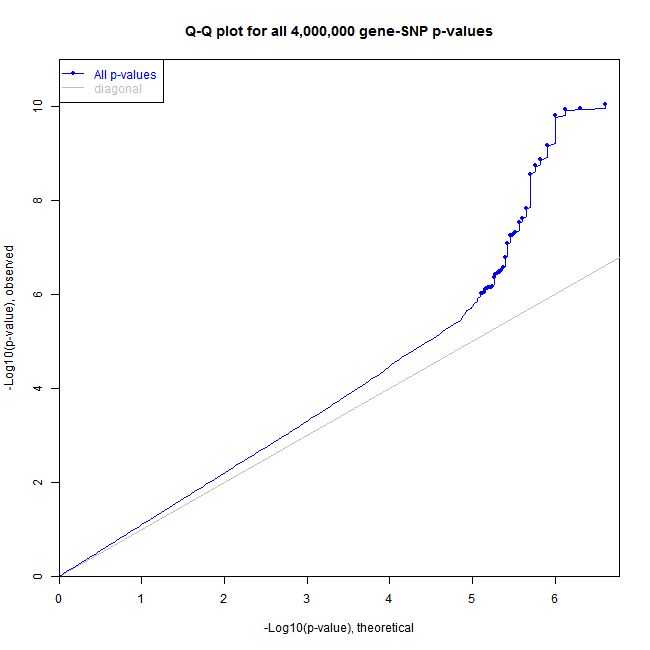
Author(s)
Andrey Shabalin ashabalin@vcu.edu
References
The package website: http://www.bios.unc.edu/research/genomic_software/Matrix_eQTL/
See Also
See Matrix_eQTL_engine for reference and sample code.
Examples
library(MatrixEQTL)

# Number of samples
n = 100;

# Number of variables
ngs = 2000;

# Common signal in all variables
pop = 0.2*rnorm(n);

# data matrices
snps.mat = matrix(rnorm(n*ngs), ncol = ngs) + pop;
gene.mat = matrix(rnorm(n*ngs), ncol = ngs) + pop + snps.mat*((1:ngs)/ngs)^9/2;

# data objects for Matrix eQTL engine
snps1 = SlicedData$new( t( snps.mat ) );
gene1 = SlicedData$new( t( gene.mat ) );
cvrt1 = SlicedData$new( );
rm(snps.mat, gene.mat)

# Slice data in blocks of 500 variables
snps1$ResliceCombined(500);
gene1$ResliceCombined(500);

# Produce no output files
filename = NULL; # tempfile()

# Perform analysis recording information for a histogram
meh = Matrix_eQTL_engine(
    snps = snps1,
    gene = gene1,
    cvrt = cvrt1,
    output_file_name = filename,
    pvOutputThreshold = 1e-100,
    useModel = modelLINEAR,
    errorCovariance = numeric(),
    verbose = TRUE,
    pvalue.hist = 100);

plot(meh, col="grey")

# Perform analysis recording information for a QQ-plot
meq = Matrix_eQTL_engine(
    snps = snps1,
    gene = gene1,
    cvrt = cvrt1,
    output_file_name = filename,
    pvOutputThreshold = 1e-6,
    useModel = modelLINEAR,
    errorCovariance = numeric(),
    verbose = TRUE,
    pvalue.hist = "qqplot");

plot(meq)