SCORE-Seq
SCORE-Seq: Score Tests for Detecting Disease Associations With Rare Variants in Sequencing Studies
SCORE-Seq is a command-line program which implements score statistics for detecting disease associations with rare variants in sequencing studies. The mutation information is aggregated across multiple variant sites of a gene through a weighted linear combination and then related to disease phenotypes through appropriate regression models. The weights can be constant or dependent on allele frequencies and phenotypes. The association testing is based on score statistics. The allele-frequency threshold can be fixed or variable. Statistical significance can be assessed by using asymptotic normal approximation or resampling. The current release covers binary and continuous traits with arbitrary covariates under case-control and cross-sectional sampling. The newest version was released on March 20, 2013 with several new features. We are working intensely to improve the capabilities of SCORE-Seq, so please check back frequently for updates.
General information
SCORE-Seq is a command-line program written in the C language to implement the methods of Lin and Tang (2011) and related methods for detecting disease associations with rare variants in sequencing studies. In the software, various tests are conducted for each gene. There are options for the minor allele frequency (MAF) upper bound, the call rate (CR) lower bound and the minor allele count (MAC) lower bound. A variant is deleted if its MAF is greater than the MAF upper bound or its CR is lower than the CR lower bound. A gene is excluded from the analysis if the MAFs of all its variants are greater than the MAF upper bound, the CRs of all its variants are smaller than the CR lower bound or its MAC is smaller than the MAC lower bound. By default, the MAF upper bound is 0.05, the CR lower bound is 0 and the MAC lower bound is 1. The MAFs may be determined internally (i.e., calculated from the genotype file) or externally (i.e., input in the mapping file). Under the additive genetic model (default), the test statistics are based on one or several sets of genetic scores that are calculated by a weighted sum of mutation counts for each subject. A set of genetic scores corresponds to a specifically defined weight function. A description of the genetic score and weight function for each test is given in the OPTIONS section below. A fixed-threshold test only involves one set of genetic scores in the test statistic, while a variable threshold test involves multiple sets of genetic scores. We perform three fixed-threshold tests (T1, T5 and MB), one variable-threshold test (VT test), and SNP-set (Sequence) kernel association test (SKAT) (Wu et al. 2011). T1 and T5 pertain to the MAF thresholds of 1% and 5%, respectively. The user may request any threshold less than 5% (e.g. 3% or 0.5%) by setting the MAF upper bound to the desired threshold. Asymptotic p-values are provided by default while resampling p-values can be generated by using the option -resample. The software also outputs the p-value of the EREC test (for detecting variants with opposite effects) if resampling is turned on. In addition, the T1, T5, VT, and SKAT tests under the dominant (recessive) genetic model can be obtained by using the option -dominant (-recessive). In that case, all the tests based on the additive genetic model are suppressed. Under the additive or dominant (recessive) model, MAC is defined as the number of subjects with at least one (two) observed mutation. Besides the rare variant analysis described above, the user can conduct single variant analysis for common SNPs by using the option -com. To suppress the rare variant analysis, use the option -noRare. For all the tests, the (possibly multivariate) score statistic and the information matrix are provided to facilitate the meta-analysis through the accompanying software MASS.
SYNOPSIS
SCORE-Seq [-dominant] [-recessive] [-pfile phenofile] [-gfile genofile] [-mfile mapfile] [-wfile wfile] [-ofile outfile] [-vtlog vtlog] [-snplog snplog] [-multilog multilog] [-msglog msglog] [-MAF MAF_UB] [-MAC MAC_LB] [-CR CR_LB] [-resample R] [-EREC delta] [-noRare] [-com MAF_C] [-ofileC outfile_com] [-INT] [-R-INT SD_TYPE]
OPTIONS
| Option | Parameter | Default | Description |
|---|---|---|---|
| -dominant | No | Use the dominant instead of the additive model. | |
| -recessive | No | Use the recessive instead of the additive model. | |
| -pfile | {phenofile} | pheno.txt |
Specify the file for the phenotype and covariates. |
| -gfile | {genofile} | geno.txt |
Specify the genotype file. |
| -mfile | {mapfile} | mapping.txt |
Specify the gene-SNP mapping file for the rare variant analysis. |
| -wfile | {wfile} | No | Specify the file that contains the customized weight matrix. |
| -ofile | {outfile} | rare.out |
Specify the output file for the rare variant analysis. |
| -vtlog | {vtlog} | vt.log |
Specify the log file that contains the score statistic and the information matrix for the MAF thresholds within a gene. |
| -snplog | {snplog} | snp.log |
Specify the log file that contains the score statistic and the information matrix for SNPs within a gene. |
| -multilog | {multilog} | No | Specify the log file that contains the score statistic and the information matrix for the set of burden scores based on the customized weight matrix. |
| -msglog | {msglog} | No | Specify the log file for warning messages |
| -MAF | {MAF_UB} | 0.05 |
Specify the MAF upper bound, which is any number between 0 and 1. |
| -MAC | {MAC_LB} | 1 |
Specify the MAC lower bound, which is any integer. |
| -CR | {CR_LB} | 0 |
Specify the call rate lower bound, which is any number between 0 and 1. |
| -resample | {R} | No | Turn on resampling and specify the maximum number of resamples. If R is set to -1, then the default of 1 million resamples is applied; otherwise, R should be an integer between 1 million and 100 millions. In the latter case, the software will perform resampling up to R times for any resampling test that has a p-value < 1e-4 after 1 million resamples. |
| -EREC | {delta} | 1 for binary trait; 2 for standardized continuous trait |
Specify the constant delta for the EREC test. This option is effective only when resampling is turned on. |
| -noRare | No | Turn off the rare variant analysis. | |
| -com | {MAF_C} | No | Turn on the single variant analysis for common SNPs (MAF > MAF_C). |
| -ofileC | {outfile_com} | com.out |
Specify the output file for the single variant analysis. |
| -INT | No |
Apply inverse normal transformation (INT) to the continuous trait. | |
| -R-INT | {SD_TYPE} | 1 |
Apply rescaled inverse normal transformation (R-INT) to the continuous trait using conventional standard deviation (if SD_TYPE=1) or the robust standard deviation (if SD_TYPE=2) described here http://en.wikipedia.org/wiki/Median_absolute_deviation. |
Suppose that for the gene of interest there are m SNPs with MAFs less than MAF_UB and call rates greater than CR_LB. Under the additive model, the genetic score for subject i is calculated by the following formula:
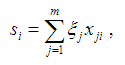
where xji is the number of the minor allele for subject i at SNP j, ξj is the weight for SNP j. If xji is missing, its value is imputed by the mean number of the minor allele at SNP j.
T1 test: Set the weight to 1 if MAF < 1% and to 0 otherwise.
T5 test: Set the weight to 1 if MAF < 5% and to 0 otherwise.
MB test: Set the weight to
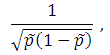
where  is the estimated MAF with pseudo counts in the pooled sample if the MAFs are calculated internally; otherwise, is the MAF from the external source. MB stands for Madsen and Browning. Lin and Zeng (2011) called this test F_p to emphasize that, for case-control studies, the MAFs are calculated from the pooled sample rather than the sample of unaffected subjects originally suggested by Madsen and Browning (2009).
VT test: Set the weight to 1 if MAF ≤ threshold and to 0 otherwise. The thresholds consist of the unique MAFs that aggregate at least MAC_LB mutations. If the number of qualified thresholds exceeds 20, we reduce the number to ≤ 20 for the asymptotic test by rounding the MAFs. If the number of thresholds is still more than 20 after rounding, we skip the lowest thresholds until the number of thresholds is 20.
EREC test: Set the weight to the estimated regression coefficient plus or minus delta. The test statistic is maximized over the two sets of weights.
Customized test: In the customized weight file, a weight vector  resides in a column. If the weight matrix has d columns, then d genetic scores will be created. The test statistic is maximized over the d sets of weights. The (vector-valued) score statistic and the information matrix will be output to the file multilog.
Under the dominant model, the T1, T5 and VT tests remain valid and can be performed by specifying the option -dominant. We set si to 1 if there is at least one mutation among the aggregating variants and to 0 otherwise. If there are missing values among the aggregating variants and the values at the non-missing sites are all zero, then we set si to the empirical probability that there is at least one mutation among the missing sites of the ith subject.
Under the recessive model, the T1, T5 and VT tests remain valid and can be performed by specifying the option -recessive. We set si to 1 if there are at least two mutations among the aggregating variants and to 0 otherwise. If there are missing values among the aggregating variants and the values at the non-missing sites are all zero, then we set si to the empirical probability that there are at least two mutations among the missing sites of the ith subjects. If there is one mutation at the non-missing sites, then we set si to the empirical probability that there is at least one mutation among the missing sites of the ith subject.
INPUT FILES
The input files consist of the phenotype, genotype and mapping files. In all input files, the 1st column contains the ID (subject ID in the phenotype file; SNP ID in the genotype file; gene ID in the gene-SNP mapping file). No missing values are allowed in the ID. Field separator character should be tab-delimiter.
PHENOTYPE FILE
The rows represent subjects. The 1st column contains the subject ID; the 2nd column contains the quantitative or binary phenotype; the remaining columns are covariates if there are any. The binary phenotype takes the value 0 or 1. The order of subjects in the rows of this file should be identical to the order of subjects in the columns of the genotype file. No missing values are allowed. We recommend the user to remove the subjects with missing phenotype values and to impute the missing covariate values by their sample means beforehand. All variables should be numeric.
GENOTYPE FILE
The rows represent SNPs and the columns represent subjects. The 1st column contains the SNP ID. The genotype takes the value 0, 1 or 2. Missing values are denoted as “NA”. For each SNP, there is at least one non-missing value among the subjects.
MAPPING FILE
This file contains at least two columns. The first column is the gene ID, and the second column is the SNP ID. Each row represents a unique gene-SNP pair. The third column contains the external MAFs if they are to be used in the analysis. The fourth column contains the external MAF threshold flags, which indicate by the values 1 vs 0, whether the thresholds will be used in the VT test. For each gene, the total number of thresholds cannot exceed 20. No missing values are allowed. If the user only requests the single variant analysis, the mapping file is not required.
WEIGHT FILE
The first column is the gene ID, and the second column is the SNP ID. The remaining columns contain vectors of weights.
OUTPUT
OUTPUT FILE OF THE SINGLE-VARIANT ANALYSIS

In this file, Pvalue and Pvalue_R are the asymptotic and resampling p-values, respectively, and U, V and Z denote the score statistic, its variance estimate and the standardized test statistic U/V1/2.
OUTPUT FILE OF THE RARE-VARIANT ANALYSIS
The format of the output file is as follows:


where P and R indicate asymptotic and resampling p-values, respectively, and U, V and Z are as defined above. Under the dominant or recessive model, only the results for T1, T5, VT, and SKAT will be provided. If the result is invalid for some reason, output ‘NA’.
VT LOG
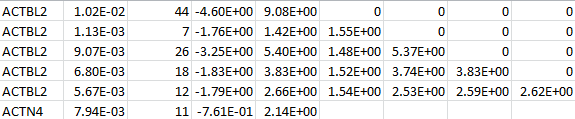
For each gene, VT LOG contains the MAF thresholds, the MACs, the (vector-valued) score statistic, and the information matrix. The following is an example for two genes:
SNP LOG
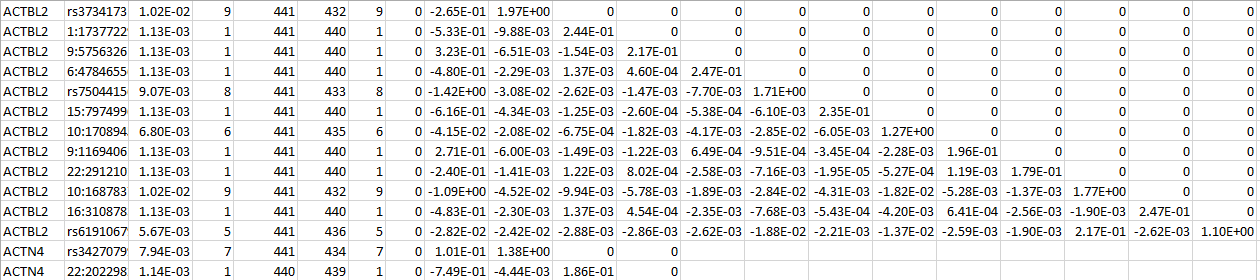
For a set of SNPs within a gene, SNP LOG contains the SNP IDs, the MAFs, the MACs, the count of non-missing genotypes, the counts of homozygous reference, heterozygous, and homozygous alternative, the (vector-valued) score statistic, and the information matrix. The following is an example for two genes:
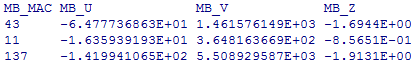
MULTI LOG
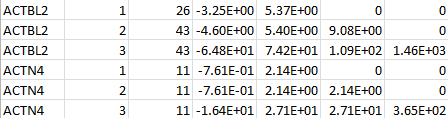
For a set of genetic scores based on the customized weight matrix within a gene, MULTI LOG contains the weight identifiers, the MACs, the score statistic and the information matrix. The following is an example for two genes:
WARNING MESSAGES
In some situations, p-values cannot be calculated.
- If a gene only contains common SNPs (i.e., MAF > MAF_UB), all its SNPs have call rates less than CR_LB or its MAC is less than MAC_LB, then no p-value can be calculated. In that case, the gene will not appear in any output file.
“GENE x Warning: All SNP MAFs > <MAF_UB> or
call rate < <CR_LB> or minor allele
count < <MAC_LB>, so p-values
are not calculated.” - For any of the observed test statistics, if the variance estimate is 0, no p-value is calculated for the test. In the following warning message, “<>” can be “T1”, “T5”, “MB”, or “VT”.
“GENE x Warning: Variance estimate=0 for observed <> test
statistic, so the p-value cannot be calculated.”
In other situations, p-values can be calculated but may not be accurate.
- For asymptotic VT tests, the calculation of the p-value depends on an accurate multivariate normal (mvn) probability evaluation. If the mvn probability is not accurate, the p-value is problematic.
“GENE x Warning: The asymptotic VT p-value
may not be accurate.” - For SKAT, the calculation of the p-value depends on an accurate mixture chi-square probability evaluation. If the evaluation is not accurate, the p-value is problematic.
“GENE x warning: The SKAT p-value may not be accurate.”
- If the default maximum number of resamples (i.e., 1 million) is applied and the resampling p-value < 1e-4, a warning message will alert you that the p-value may not be accurate. In the following warning message, “<>” can be “T1”, “T5”, “MB”, “VT”, or “EREC”.
“GENE x Warning: The resampling p-value of <> test <
1e-4 after 1 million resamples, so the p-value may not be
accurate.”
EXAMPLE
The example includes a genotype file “genoP.txt“, a phenotype file “phenoP.txt” and a mapping file “mappingP.txt“. Enter the command
$ SCORE-Seq -pfile phenoP.txt -gfile genoP.txt -mfile mappingP.txt -ofile rareP.txt -vtlog vtP.log –snplog snpP.log -msglog msg.log -MAF 0.05 -MAC 5 -resample -1
to obtain the results of rare-variant tests (T1, T5, MB, VT, SKAT and EREC).
MULTIPLE CPUs
If there are a large number of genes, it is preferable to use multiple CPUs. To this end, the user can divide the mapping file into several files, each of which contains a subset of genes. Then the software can be run separately for each mapping file on a different CPU. In this way, it takes approximately 1/K (K is the number of jobs that are split into) of the original time to complete the whole set of analysis. We provide a R script to illustrate this approach. In that example, 100 mapping files are created from the original mapping file and 100 jobs are submitted simultaneously to multiple CPUs.
REFERENCES
Madsen, B.E., and Browning, S.R. (2009). A groupwise association test for rare mutations using a weighted sum statistic. PLoS Genet. 5, e1000384.
Lin, D. Y. and Tang, Z. Z. (2011). A General Framework for Detecting Disease Associations With Rare Variants in Sequencing Studies. American Journal of Human Genetics, 89, 354-367.
Wu, M. C., Lee, S., Cai, T., Li, Y., Boehnke, M., and Lin, X. (2011) Rare Variant Association Testing for Sequencing Data Using the Sequence Kernel Association Test (SKAT). American Journal of Human Genetics , 89, 82-93.
DOWNLOAD
SCORE-Seq for 64-bit x86 based Linux [updated November 18, 2015]
Example files [updated November 18, 2015]
VERSION HISTORY
| Version | Date | Description |
|---|---|---|
| 1 | August 4, 2011 | First version released |
| 1.0.4 | September 1, 2011 | Revised version; added many new features |
| 1.0.5 | September 9, 2011 | Minor updates |
| 2 | November 3, 2011 | Changed the constant for the EREC from delta to +/- delta.Allowed the use of external MAFs in the analysis.Allowed single variant analysis for common SNPs. |
| 2.0.1 | December 6, 2011 | Revised the format of the p-value output file.Fixed a bug in handling output files. |
| 3.0 | May 21, 2012 | Added the option “-CR” for the call rate lower bound.Added T1, T5 and VT under the dominant model (-dominant).
Removed Tmax. Output score statistics, their variance estimates and test statistics for fixed-threshold tests. Output the original test statistics instead of their absolute values in the VT LOG file. Invalid values are shown as “NA” instead of Change the default MAC lower bound to 1. |
| 4.0 | August 9, 2012 | Changed the name “Fp” to “MB”.Added T1, T5 and VT under the recessive model (-recessive). |
| 5.0 | March 20, 2013 | Estimated the covariance matrix for the VT test by the information matrix instead of the efficient score functions.Added the SKAT test.
Added the customized test. Allowed mapping file to contain the threshold indicators for the VT test. Changed the format of the output file vtlog. Output score statistics and information matrices for all tests. |
| 5.1 | May 15, 2013 | Minor format changes in the output file of the rare-variant analysis and the MULTI log file of the customized test. |
| 5.2 | July 03, 2013 | Added the SKAT resampling test. |
| 5.3 | February 22, 2015 | Removed the MAC filter on the single variant.Added the number of observation for each SNP in the file snplog.
Output residual variance to the log files (vtlog, snplog, multilog) for the continuous trait. |
| 6 | June 16, 2015 | Added the options –INT and –R-INT. |
| 7 | July 29, 2015 | Added number of samples (#Samples) in the heading for the all the log files.
In the SNP log file, added columns for counts of homozygous reference, heterozygous, and homozygous alternative. |
| 7.1 | November 18, 2015 | Output statistics for monophonic sites in the SNP log file.
In the SNP log file, calculate MAC under the additive model instead of the dominant model. Modify the covariance estimator for score statistics when the trait is continuous. |