MASS
MASS: Meta-Analysis of Sequencing Studies
General information
MASS is a command-line program written in C to perform fixed-effects (FE) and random-effects (RE) meta-analysis of sequencing studies by combining the score statistics from multiple studies. It implements three types of tests that encompass all commonly used association tests for rare variants, including simple burden test, CMC test (Li and Leal, 2008), weighted sum statistic (Madsen and Browning, 2009), variable-threshold (VT) test (Price et al., 2010; Lin and Tang, 2011), C-alpha test (Neale et al., 2011) and SKAT (Wu et al., 2011). The input file can be generated from the accompanying software SCORE-Seq. This bundle of programs allows meta-analysis of sequencing studies in a statistically accurate, numerically stable and computationally efficient manner.
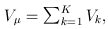
Suppose that we are interested in d genetic variables. For the burden and VT tests, the genetic variables pertain to the burden scores; for the variant-component (VC) test, the genetic variables pertain to the genotypes of individual variants; for the CMC test (Li and Leal, 2008), the genetic variables contain the genotypes of common variants and the burden scores of rare variants. Suppose that there are K independent studies. For the kth study, we calculate the (multivariate) score statistic Uk for testing the null hypothesis H0 that none of the d genetic variables have any effect on the trait of interest, and we also calculate the corresponding information matrix Vk. Note that Uk is a d × 1 vector and Vk is a d × d matrix.
Based on Uk and Vk (k=1,…,K), MASS can perform three types of gene-based tests under fixed-effects and random-effects models. The FE test statistic provides a test of the mean genetic effects (Tang and Lin 2013a). The RE test statistic provides a joint test of the mean and the heterogeneity of the genetic effects among the studies (Tang and Lin 2013b).
1. Burden Tests:
1.1 Single burden score
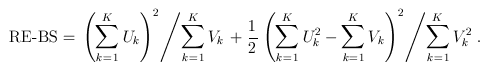
For the simple burden test (T1/T5/MB), there is only one genetic variable, which is the burden score (e.g., based on a MAF threshold or the Madsen-Browning weighting). The FE and RE test statistics are:
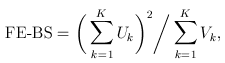
and
1.2 Multiple burden scores
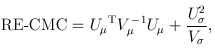
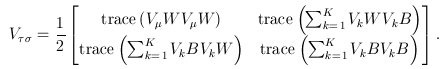
For the CMC (Li and Leal, 2008) and other tests involving multiple burden scores, the test statistics take a multivariate form:
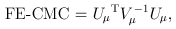
and
where 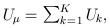
 and
and  The matrix B is the between-study covariance matrix with the following structure
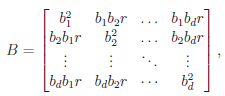
where  controls the relative degrees of heterogeneity for the d genetic effects and r specifies the correlation of heterogeneity. The values of are referred to as between-study weights in MASS and are set to (1,…,1) in the CMC tests by default. The values can also be specified differently by the option –B. By default, we set r =0. Alternatively, we may choose the value of r that yields the smallest p-value for RE-CMC. The resulting test statistic is denoted by RE-CMC-O. The series of numbers used in the grid search to find the minimum p-value can be specified by the option –O.
2. VT Tests:
For the VT method, the genetic variables correspond to the burden scores at d MAF thresholds. We perform a burden test at each MAF threshold and choose the threshold that produces the largest test statistic. Thus, the VT test statistics are defined by
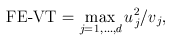
and
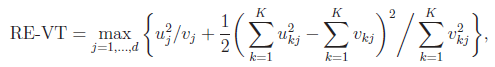
where uj and ukj are the jth components of  and Uk , respectively, and vj and vkj are the jth diagonal elements of
  and Vk, respectively.
3. VC Tests:
For the VC test, the genetic variables consist of the individual genotypes of d variants. The score test statistics are
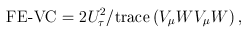
and
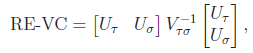
where 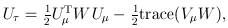
 was defined below RE-CMC but now pertains to individual variants instead of burden scores, and
The matrix W is the within-study covariance matrix with the following structure
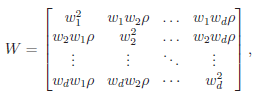
where  controls the relative variances of the d genetic effects and
  indicates the correlation of the d effects. The elements of are referred to as within-study weights in MASS. The values of within-study weights and between-study weights are calculated according to the Beta density function Beta(1,25,MAF) in VC tests (and VC-O tests described below) and can be specified differently by the options –W and –B, respectively. In VC tests, we set = 0 for FE-VC and = r = 0 for RE-VC. In addition, MASS implements Het-SKAT which is another version of the the VC test proposed by Lee et al.
4. VC-O Tests:
We can choose the value of that yields the smallest p-value for FE-VC and the combination of and r that yields the smallest p-value for RE-VC. The resulting test statistics are denoted by FE-VC-O and RE-VC-O, respectively. The series of numbers used in the grid search can be specified by the option –O. MASS also implements Het-SKAT-O which is another version of the VC-O test proposed by Lee et al.
For FE-BS and FE-CMC, we obtain the p-values analytically based on the chi-square distribution with d degrees of freedom. For the other tests, we use Monte Carlo simulation to obtain the p-values by default. To be specific, we repeatedly generate Uk from the d-variate normal distribution with mean 0 and covariance matrix Vk for k = 1,…,K and recalculate the test statistic. The p-value is set to be the proportion of the simulated test statistics that are greater than the observed test statistic. To improve computational efficiency, we employ an adaptive procedure which uses a small number of simulations for a large p-value and a large number of simulations for an extreme p-value. The maximum number of Monte Carlo simulations can be specified by the option –MC. If the option –A is used, RE tests will be suppressed and asymptotic FE tests will be performed. The asymptotic distribution for FE-VT is determined by the multivariate normal distribution of (Lin and Tang, 2011) and the asymptotic distribution for FE-VC is determined by  where
where  is the jth eigenvalue of
  and
and  are independent
  random variables.
MASS accommodates both the additive and the dominant modes of inheritance. Under the additive mode of inheritance (default), MASS reads in the single-variant level summary statistics and constructs the burden-score level summary statistics internally. Under the dominant mode of inheritance, MASS reads in the burden-score level summary statistics directly.
SYNOPSIS
MASS [-mode mode][-condition snpList.txt][-test test][-MAC MAC_LB][-MAF MAF_UB][-W W.txt][-B B.txt][-O grids.txt][-MC N][-A][-sfile script.txt] [-ofile outfile.txt]
OPTIONS
| Option | Parameter | Default | Description |
|---|---|---|---|
| -mode | {mode} | additive |
Specify the mode of inheritance. Two options are “additive” (MASS will read in the single-variant level summary statistics), and “dominant” (MASS will read in the burden-score level summary statistics directly). |
| -condition | {snplist.txt} | No |
Specify a list of SNPs to adjust for. |
| -test | {test} | T5 |
Specify the type of gene-based tests. Under the additive model, there are six possible choices: “T1”, “T5”, “MB”, “VT”, “VC”, “VC-O”. Under the dominant model, there are two possible choices: “burden” and “VT”. |
| -MAC | {MAC_LB} | 1 |
Specify the MAC lower bound for the burden scores in the burden or VT tests. |
| -MAF | {MAF_UB} | 1 |
Specify the MAF upper bound. Only valid if single variant level information is used (T1, T5, MB, VT tests under additive genetic model, VC, and VC-O tests). |
| -W | {W.txt} | No |
Specify the file for in VC tests. |
| -B | {B.txt} | No |
Specify the file for (b1,…,bd) |
| -O | {grids.txt} | No |
Specify the file for grid(s). |
| -MC | {N} | 1000000 |
Specify the maximum number of Monte Carlo simulations for p-values. |
| -A | No | No |
Suppress RE tests and activate asymptotic FE tests. |
| -sfile | {script.txt} | No |
Specify the script file that describes the input files from multiple studies. |
| -ofile | {outfile.txt} | meta.out |
Specify the output file. |
SCRIPT FILE
The following is an example of the script file:
The text starting with # is treated as a comment and is ignored.
The syntax of the script file is as follows: KEYWORD = value.
FILE = local_path/infile
This is a required keyword that specifies the pathname of the input file. For each study, this keyword should appear prior to the other keywords. The first few columns of the input file contain the gene ID, the GVar ID and the MAC. Within a gene, the GVar ID is the unique identifier for each genetic variable. The components of the score vectors with the same GVar ID among studies are combined during meta-analysis. For the simple burden test, the GVar ID can be omitted since there is only one genetic variable (the burden score) for each gene; for the VT test, the external MAF threshold can serve as the GVar ID; for the VC test, the SNP ID can serve as the GVar ID. The next few columns of the input file contain the score vector followed by the information matrix. Since the information matrix is symmetric, it can also be input as a lower triangular matrix.
OUTCOME = outcome_type
This keyword specifies the type of the outcome in the study. Two possible values are “binary” and “continuous”. This keyword is required when the conditional analysis is requested (-condition) as the calculation of the conditional summary statistics depends on the type of the outcome.
SKIP = num_lines_to_skip
This is an optional keyword that specifies the number of lines of the input file to skip before reading the data. The default value is 0.
The following keywords are used to specify the columns for the gene ID, the GVar ID, the MAF, the MAC, the number of non-missing genotypes and the score statistic:
GENE_ID_COLUMN = col_num_for_gene_ID
This is a required keyword that specifies the column for the gene ID.
GVAR_ID_COLUMN = col_num_for_GVar_ID
This is a required keyword that specifies the column for the GVar ID. If we only have one genetic variable per gene, set col_num_for_GVar_ID to col_num_for_gene_ID.
Under the additive model, single-variant summary statistics are provided, and the pooled MAFs will be calculated. MASS adopts two approaches to calculate the pooled MAFs:
If the pooled MAF is calculated based on the study-specific MAF and the total sample size, the keyword MAF_COLUMN = col_num_for_MAF is required to specify the column for the MAF.
If the pooled MAF is calculated based on the study-specific MAC and the number of non-missing genotypes, the keywords MAC_COLUMN = col_num_for_MAC
and N_OBS_COLUMN = col_num_for_#observations
are required to specify the column for the MAC and the column for the number of non-missing observations at the SNP site, respectively.
If the burden or VT test is requested, the keyword MAC_COLUMN = col_num_for_MAC is required.
SCORE_COLUMN = col_num_for_score_vector
This is a required keyword that specifies the column for the score vector followed by the information matrix.
Note that the vector of the score statistics together with the covariance matrices resides at the last few columns of the input files. Hence, the value for SCORE_COLUMN should be larger than the values of the other *_COLUMN keywords.
SNP LIST FOR CONDITIONAL ANALYSIS
The following is an example of the SNP list for conditional analysis:
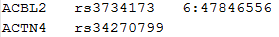
Each row starts with a gene ID, followed by a list of SNPs that we wish to adjust for in that gene. The column delimiter should be tab.
THE FILES FOR WEIGHTS
The following is an example of the file for weights:
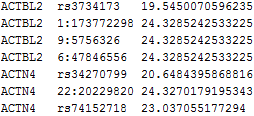
The 1st column contains the gene ID the 2nd column contains the GVar ID. The 3rd column contains the weight for each component of the score statistic. If this file is not specified, the Beta density weight (Beta(1,25,MAF)) will be used in VC test and the flat weight (1,…,1) will be used in CMC test. The column delimiter should be tab.
THE FILES FOR GRIDS
The following is an example of the file for grids:
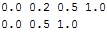
A set of grid consists of a series of numbers from 0 to 1. Each grid takes one row in the file with the numbers separated by tabs. For RE-CMC-O and FE-VC-O, one set of grid is needed and the grid in the first row of the file will be used. For RE-VC-O, two sets of grid are needed. If the two sets of grid are provided in the file, the grid in the first row is for and the grid in the second row is for r. If only one set of grid is provided, it is used for both and r. The number of elements in a grid is limited to 10. If VC-O test is requested but the grid file is not specified, the default grids “0, 0.5, 1” will be used. The column delimiter should be tab.
OUTPUT FILE
The following is an example of the default output file:
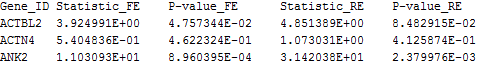
The 1st column contains the gene ID. The subsequent columns contain the FE and RE meta-analysis results. Invalid output is denoted by “NA”.
TUTORIAL: Learn by Example
In this tutorial, SCORE-Seq will be used to generate the summary statistics for individual studies and then MASS will use the output files of the SCORE-Seq as input and perform the meta-analysis for various rare-variant tests.
Step 1: Download executable files and example data sets
The first step is to download executable files for SCORE-Seq and MASS at here and here.
Download the example package here and unzip it. The files are organized in four folders: SCORE-Seq_input, SCORE-Seq_output, MASS_input and MASS_output.
Step 2: Run SCORE-Seq
In this step, we start with a genotype file, a phenotype file, a mapping file, and a weight file. These files can be found in the folder “SCORE-Seq_input” of the example package. All the output files from Step 2 can be found in the folder “SCORE-Seq_output”.
Suppose that we are interested in T1, T5, MB, VT, and VC tests, as well as a maximum test over (T1, T5, MB), which is used to adjust for multiple testing with T1, T5, and MB burden scores. In the weight file for the maximum test, the first two columns are the gene ID and SNP ID, and the last three columns pertain to the T1, T5 and MB burden scores. For T1, the entry in each row indicates, by the values 1 vs 0, whether the MAF <= 1% or >1%. For T5, the entry in each row indicates, by the values 1 vs 0, whether the MAF <= 5% or >5%. For MB, the entry in each row is the Madsen-Browning weight based on the MAF of that SNP. To obtain the score statistics for MASS, we first run the following SCORE-Seq command:
$ SCORE-Seq –pfile phenoP.txt -gfile genoP.txt –mfile mappingP.txt –wfile wfile.txt -ofile rareP.txt –vtlog vtP.log –snplog vcP.log –multilog maxP.log -MAF 0.05 -MAC 5
The file rareP.txt contains scalar score statistics and variance estimates for T1, T5, and MB tests. The files vtP.log, vcP.log, and maxP.log contain the score vectors and information matrices for VT, VC, and maximum tests, respectively. The output for the first gene ACTBL2 is shown below. The types of statistics that will be used by MASS are boxed in different shapes, and different colors of the boxes represent different tests.
The file rareP.txt contains the following:
![]()
The numbers inside the three red rectangles are the score statistics and variance estimates based on the T1, T5, and MB burden scores; the numbers inside the three red round rectangles are the corresponding MACs
The file maxP.log contains the following:
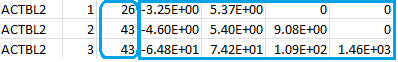
The column after the gene ID indicates the burden test by the numbers 1, 2, and 3 and will serve as the “GVar ID” during the meta-analysis in Step 3. The numbers inside the blue rectangle are the score vector (shown in the first column) and the lower triangular information matrix based on the three burden scores (T1, T5, MB). The three rows correspond to the three burden scores. You can compare, say, the score statistic (-3.25E+00) and the variance (5.37E+00) in the first row to the numbers inside the red rectangular of the file rareP.txt to reassure yourself that the first row indeed corresponds to the T1 burden score. The numbers inside the blue round rectangle are the MACs of the T1, T5, and MB burden scores.
The file vtP.log contains the following:
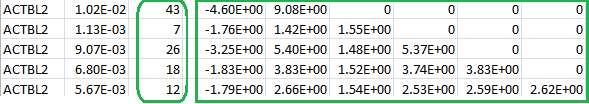
The numbers inside the green rectangle are the score vector (shown in the first column) and the lower triangular information matrix for a set of burden scores at different MAF thresholds. The column after the gene ID gives the specific MAF threshold that will serve as the “GVar ID” during meta-analysis in Step 3. The numbers inside the green round rectangle are the MACs for the set of burden scores.
The file vcP.log contains the following:
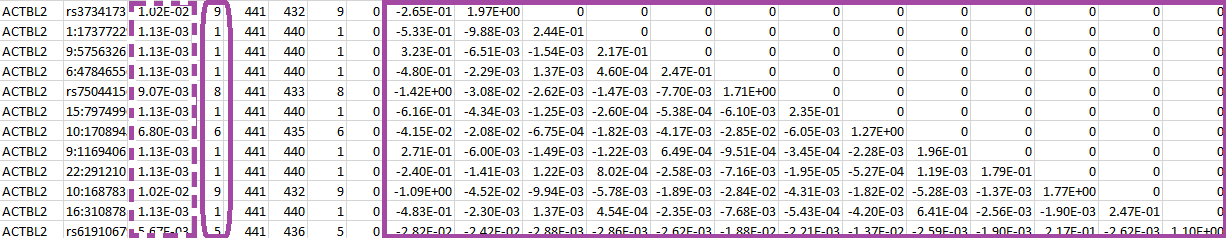
The numbers inside the purple rectangle are the score vector (shown in the first column) and the lower triangular information matrix for the set of SNPs in gene ACTBL2. The column after the gene ID gives the specific SNP ID that will serve as the “GVar ID” during the meta-analysis in Step 3. The numbers inside the purple dashed rectangle are the MAFs for the set of SNPs and the numbers inside the purple round rectangle are the MACs.
Since we apply the MAC lower bound of 5, the corresponding components of the score vector and the rows and columns of the information matrix are zeroed out for the SNPs with MACs less than 5. We keep such SNPs instead of deleting them because it is possible that these SNPs have higher MACs in other studies, so that they can still contribute to the meta-analysis. Thus, we suggest to apply an MAC lower bound during the meta-analysis instead of during the analysis of the individual studies.
Step 3: Run MASS
In this step, we will perform meta-analysis using the output from Step 2. Suppose that we want to perform meta-analysis of two studies. For simplicity, the output from Step 2 is used as the output for both studies. In this way, we can demonstrate how to perform meta-analysis by only using one set of files. For each test, a script file script_.txt is created to describe the input files from each study. All the script files for Step 3 can be found in the folder “MASS_intput” of the example package.
Suppose that we want to apply the MAC lower bound of 2 to all tests. The meta-analysis results are given in the output files meta_<test>.out. All the output files from Step 3 can be found in the folder “MASS_output” of the example package.
1. T1, T5, and MB tests
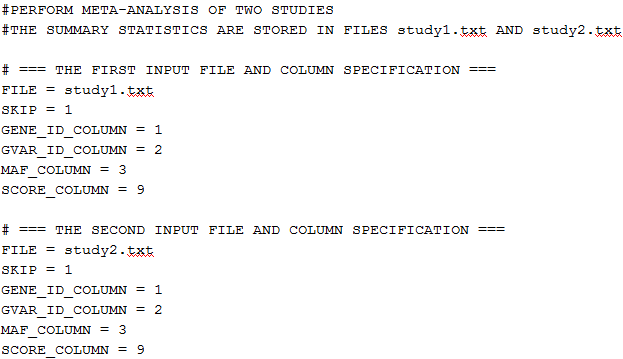
The file script_T1.txt contains the following:
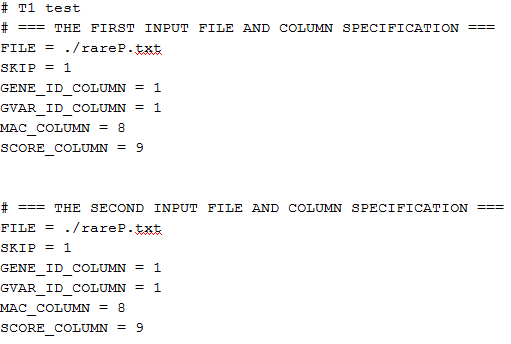
The specifications of the input files are identical for study1 and study2 because we are using the same file rareP.txt. “SKIP=1” means to skip the first row (header) in the file. “GENE_ID_COLUMN=1”, “MAC_COLUMN=8”, and “SCORE_COLUMN=9” mean that the gene ID is in the first column, the MAC is in the eighth column and the score vector is in the ninth column followed by the information matrix. The script file for the other tests can be created similarly.
The command lines are:
$ MASS -mode dominant –MAC 2 -sfile script_T1.txt -ofile meta_T1.out
$ MASS -mode dominant –MAC 2 -sfile script_T5.txt -ofile meta_T5.out
$ MASS -mode dominant –MAC 2 -sfile script_MB.txt -ofile meta_MB.out
This is the expected software output from the first command:
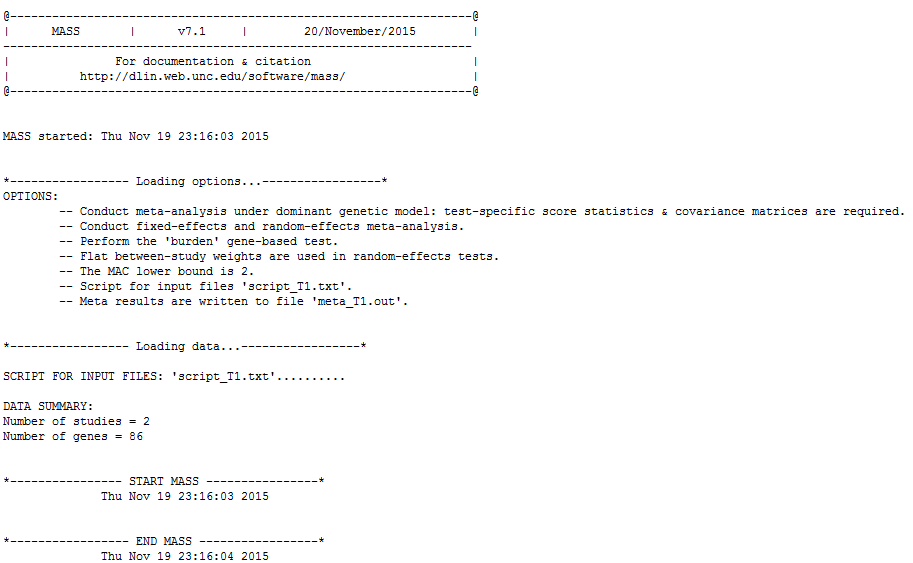
There are three sections below the heading. The first section “Loading options” gives all the options (both user-specified and default) that are going to be applied to the meta-analysis. The second section “Loading data” reflects the data loading process and summarizes the total number of studies to be combined and the total number of genes to be analyzed. The third section contains all possible messages during the analysis.
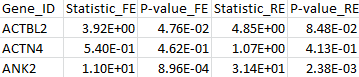
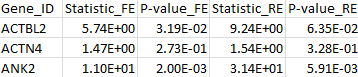
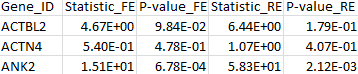
The results for the first 3 genes in the output files meta_T1.out, meta_T5.out, and meta_MB.out are shown in parallel below:
meta_T1.out |
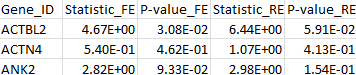
meta_T5.out |
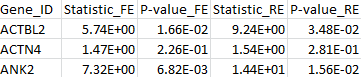
meta_MB.out |
 |
 |
 |
2. Maximum test
The command line is:
$ MASS -mode dominant –MAC 2 –test VT –sfile script_max.txt –ofile meta_max.out
The results for the first 3 genes are given in the MASS output file meta_max.out :
By comparing the output from the T1, T5, and MB tests, we can verify that the statistic of the maximum test is indeed the maximum over those three test statistics. The p-value is larger than the minimal p-value of the three tests due to the fact that the maximum test is adjusted for multiple testing.
3. VT test
The command line is:
$ MASS -mode dominant –MAC 2 –test VT –sfile script_VT.txt –ofile meta_VT.out
The results for the first 3 genes are given in the output file meta_VT.out:
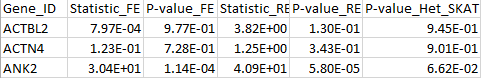
4. VC test
A file weight.txt for weights in the VC test is provided in the folder “MASS_intput” of the example package. The weight file can be easily generated based on the MAFs of the SNPs.
The command line is:
$ MASS –MAC 2 –test VC –W weight.txt –B weight.txt -sfile script_VC.txt -ofile meta_VC.out
The results for the first 3 genes are given in the output file meta_VC.out:
Example files [updated November 20, 2015]
REFERENCES
Li, B., and Leal, S.M. (2008). Methods for detecting associations with rare variants for common diseases: application to analysis of sequence data. Am. J. Hum. Genet. 83, 311-321.
Lin, D. Y. and Tang, Z. Z. (2011). A general framework for detecting disease associations with rare variants in sequencing studies. Am. J. Hum. Genet. 89:354-367.
Lin, D.Y and Zeng, D. (2010). On the relative efficiency of using summary statistics versus individual level data in meta-analysis. Biometrika, 97, 321-332.
Madsen, B.E., and Browning, S.R. (2009). A groupwise association test for rare mutations using a weighted sum statistic. PLoS Genet. 5, e1000384.
Neale, B.M., Rivas, M.A., Voight, B.F., Altshuler, D., Devlin, B., Orho-Melander, M., Kathiresan, S., Purcell, S.M., Roeder, K., and Daly, M.J. (2011). Testing for an unusual distribution of rare variants. PLoS Genet. 7, e1001322.
Price, A.L., Kryukov, G.V., de Bakker, P.I.W., Purcell, S.M., Staples, J., Wei, L.J., and Sunyaev, S.R. (2010). Pooled association tests for rare variants in exon-resequencing studies. Am. J. Hum. Genet. 86, 832-838.
Tang, Z. Z. and Lin, D. Y. (2013). MASS : meta-analysis of score statistics for sequencing studies. Bioinformatics 29, 1803–1805.
Tang, Z. Z. and Lin, D. Y. (2013). Meta-Analysis of sequencing studies under random-effects models. Submitted.
Wu, M.C., Lee, S., Cai, T., Li, Y., Boehnke, M., and Lin, X. (2011). Rare variant association testing for sequencing data using the sequence kernel association test (SKAT). Am. J. Hum. Genet. 89, 82-93.
DOWNLOAD
MASS for 64-bit x86 based Linux [updated November 20, 2015]
VERSION HISTORY
| Version | Date | Description |
|---|---|---|
| 1.0 | May 23, 2012 | First version released |
| 2.0 | Sep 04, 2012 | Expanded the software to perform multivariate meta-analysis. |
| 3.0 | Mar 19, 2013 | Expanded the software to perform weighted quadratic test. Added the MAC filter. |
| 4.0 | May 15, 2013 | Used a script file to describe the input files from multiple studies and adjusted the option list accordingly. |
| 5.0 | Sep 18, 2013 | Added the random-effects tests. |
| 5.1 | February 24, 2015 | Incorporated the Het-SKAT and Het-SKAT-O tests. Accommodated the additive mode of inheritance and set it as default. |
| 7.0 | July 29, 2015 | Accommodate the summary statistics generated by SCORE-Seq (v7) and SCORE-SeqTDS (v7). |
| 7.1 | November 20, 2015 | Added alternative way to calculate pooled MAF by using the study-specific MAF and the total sample size. Kept duplicate SNP-level summary statistics in the meta-analysis. |