The toy dataset consists of five files: genotype SNP.txt
, expression GE.txt
, a file Covariates.txt
with two covariates, gender and age, and files geneloc.txt
and snpsloc.txt
with gene and SNP location information. First three files contain artificial information for 16 samples. The sample genotype file contains random values 0, 1, and 2 although the input genotype file is allowed to contain any real values.
# Matrix eQTL by Andrey A. Shabalin
# http://www.bios.unc.edu/research/genomic_software/Matrix_eQTL/
#
# Be sure to use an up to date version of R and Matrix eQTL.
# source("Matrix_eQTL_R/Matrix_eQTL_engine.r");
library(MatrixEQTL)
## Location of the package with the data files.
base.dir = find.package('MatrixEQTL');
# base.dir = '.';
## Settings
# Linear model to use, modelANOVA, modelLINEAR, or modelLINEAR_CROSS
useModel = modelLINEAR; # modelANOVA, modelLINEAR, or modelLINEAR_CROSS
# Genotype file name
SNP_file_name = paste(base.dir, "/data/SNP.txt", sep="");
# Gene expression file name
expression_file_name = paste(base.dir, "/data/GE.txt", sep="");
# Covariates file name
# Set to character() for no covariates
covariates_file_name = paste(base.dir, "/data/Covariates.txt", sep="");
# Output file name
output_file_name = tempfile();
# Only associations significant at this level will be saved
pvOutputThreshold = 1e-2;
# Error covariance matrix
# Set to numeric() for identity.
errorCovariance = numeric();
# errorCovariance = read.table("Sample_Data/errorCovariance.txt");
## Load genotype data
snps = SlicedData$new();
snps$fileDelimiter = "\t"; # the TAB character
snps$fileOmitCharacters = "NA"; # denote missing values;
snps$fileSkipRows = 1; # one row of column labels
snps$fileSkipColumns = 1; # one column of row labels
snps$fileSliceSize = 2000; # read file in slices of 2,000 rows
snps$LoadFile(SNP_file_name);
## Load gene expression data
gene = SlicedData$new();
gene$fileDelimiter = "\t"; # the TAB character
gene$fileOmitCharacters = "NA"; # denote missing values;
gene$fileSkipRows = 1; # one row of column labels
gene$fileSkipColumns = 1; # one column of row labels
gene$fileSliceSize = 2000; # read file in slices of 2,000 rows
gene$LoadFile(expression_file_name);
## Load covariates
cvrt = SlicedData$new();
cvrt$fileDelimiter = "\t"; # the TAB character
cvrt$fileOmitCharacters = "NA"; # denote missing values;
cvrt$fileSkipRows = 1; # one row of column labels
cvrt$fileSkipColumns = 1; # one column of row labels
if(length(covariates_file_name)>0) {
cvrt$LoadFile(covariates_file_name);
}
## Run the analysis
me = Matrix_eQTL_engine(
snps = snps,
gene = gene,
cvrt = cvrt,
output_file_name = output_file_name,
pvOutputThreshold = pvOutputThreshold,
useModel = useModel,
errorCovariance = errorCovariance,
verbose = TRUE,
pvalue.hist = TRUE,
min.pv.by.genesnp = FALSE,
noFDRsaveMemory = FALSE);
unlink(output_file_name);
## Results:
cat('Analysis done in: ', me$time.in.sec, ' seconds', '\n');
cat('Detected eQTLs:', '\n');
show(me$all$eqtls)
## Plot the histogram of all p-values
plot(me)
# Matrix eQTL by Andrey A. Shabalin
# http://www.bios.unc.edu/research/genomic_software/Matrix_eQTL/
#
# Be sure to use an up to date version of R and Matrix eQTL.
# source("Matrix_eQTL_R/Matrix_eQTL_engine.r");
library(MatrixEQTL)
## Location of the package with the data files.
base.dir = find.package('MatrixEQTL');
# base.dir = '.';
## Settings
# Linear model to use, modelANOVA, modelLINEAR, or modelLINEAR_CROSS
useModel = modelLINEAR; # modelANOVA, modelLINEAR, or modelLINEAR_CROSS
# Genotype file name
SNP_file_name = paste(base.dir, "/data/SNP.txt", sep="");
snps_location_file_name = paste(base.dir, "/data/snpsloc.txt", sep="");
# Gene expression file name
expression_file_name = paste(base.dir, "/data/GE.txt", sep="");
gene_location_file_name = paste(base.dir, "/data/geneloc.txt", sep="");
# Covariates file name
# Set to character() for no covariates
covariates_file_name = paste(base.dir, "/data/Covariates.txt", sep="");
# Output file name
output_file_name_cis = tempfile();
output_file_name_tra = tempfile();
# Only associations significant at this level will be saved
pvOutputThreshold_cis = 2e-2;
pvOutputThreshold_tra = 1e-2;
# Error covariance matrix
# Set to numeric() for identity.
errorCovariance = numeric();
# errorCovariance = read.table("Sample_Data/errorCovariance.txt");
# Distance for local gene-SNP pairs
cisDist = 1e6;
## Load genotype data
snps = SlicedData$new();
snps$fileDelimiter = "\t"; # the TAB character
snps$fileOmitCharacters = "NA"; # denote missing values;
snps$fileSkipRows = 1; # one row of column labels
snps$fileSkipColumns = 1; # one column of row labels
snps$fileSliceSize = 2000; # read file in slices of 2,000 rows
snps$LoadFile(SNP_file_name);
## Load gene expression data
gene = SlicedData$new();
gene$fileDelimiter = "\t"; # the TAB character
gene$fileOmitCharacters = "NA"; # denote missing values;
gene$fileSkipRows = 1; # one row of column labels
gene$fileSkipColumns = 1; # one column of row labels
gene$fileSliceSize = 2000; # read file in slices of 2,000 rows
gene$LoadFile(expression_file_name);
## Load covariates
cvrt = SlicedData$new();
cvrt$fileDelimiter = "\t"; # the TAB character
cvrt$fileOmitCharacters = "NA"; # denote missing values;
cvrt$fileSkipRows = 1; # one row of column labels
cvrt$fileSkipColumns = 1; # one column of row labels
if(length(covariates_file_name)>0) {
cvrt$LoadFile(covariates_file_name);
}
## Run the analysis
snpspos = read.table(snps_location_file_name, header = TRUE, stringsAsFactors = FALSE);
genepos = read.table(gene_location_file_name, header = TRUE, stringsAsFactors = FALSE);
me = Matrix_eQTL_main(
snps = snps,
gene = gene,
cvrt = cvrt,
output_file_name = output_file_name_tra,
pvOutputThreshold = pvOutputThreshold_tra,
useModel = useModel,
errorCovariance = errorCovariance,
verbose = TRUE,
output_file_name.cis = output_file_name_cis,
pvOutputThreshold.cis = pvOutputThreshold_cis,
snpspos = snpspos,
genepos = genepos,
cisDist = cisDist,
pvalue.hist = "qqplot",
min.pv.by.genesnp = FALSE,
noFDRsaveMemory = FALSE);
unlink(output_file_name_tra);
unlink(output_file_name_cis);
## Results:
cat('Analysis done in: ', me$time.in.sec, ' seconds', '\n');
cat('Detected local eQTLs:', '\n');
show(me$cis$eqtls)
cat('Detected distant eQTLs:', '\n');
show(me$trans$eqtls)
## Plot the Q-Q plot of local and distant p-values
plot(me)
library('MatrixEQTL')
# Number of samples
n = 100;
# Number of variables
ngs = 2000;
# Common signal in all variables (population stratification)
pop = 0.2 * rnorm(n);
# data matrices
snps.mat = matrix(rnorm(n*ngs), ncol = ngs) + pop;
gene.mat = matrix(rnorm(n*ngs), ncol = ngs) + pop + snps.mat*((1:ngs)/ngs)^9/2;
# data objects for Matrix eQTL engine
snps1 = SlicedData$new( t( snps.mat ) );
gene1 = SlicedData$new( t( gene.mat ) );
cvrt1 = SlicedData$new( );
rm(snps.mat, gene.mat)
# Slice data in blocks of 500 variables
snps1$ResliceCombined(500);
gene1$ResliceCombined(500);
# name of temporary output file
filename = tempfile();
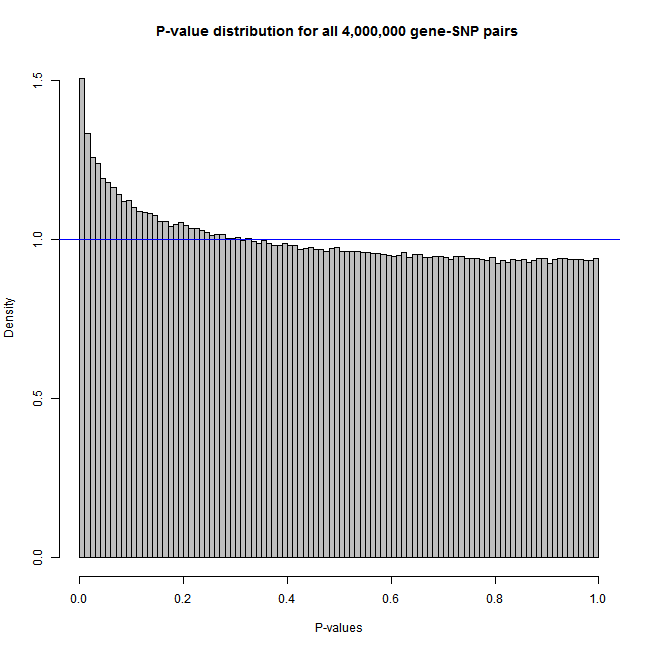
# Perform analysis recording information for
# a histogram
meh = Matrix_eQTL_engine(
snps = snps1,
gene = gene1,
cvrt = cvrt1,
output_file_name = filename,
pvOutputThreshold = 1e-100,
useModel = modelLINEAR,
errorCovariance = numeric(),
verbose = TRUE,
pvalue.hist = 100);
unlink( filename );
# png(filename = "histogram.png", width = 650, height = 650)
plot(meh, col="grey")
# dev.off();
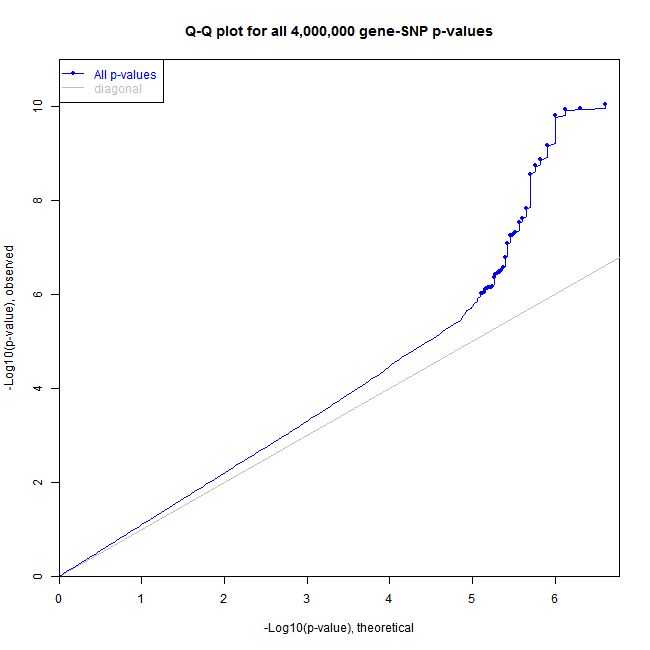
# Perform the same analysis recording information for
# a Q-Q plot
meq = Matrix_eQTL_engine(
snps = snps1,
gene = gene1,
cvrt = cvrt1,
output_file_name = filename,
pvOutputThreshold = 1e-6,
useModel = modelLINEAR,
errorCovariance = numeric(),
verbose = TRUE,
pvalue.hist = "qqplot");
unlink( filename );
# png(filename = "QQplot.png", width = 650, height = 650)
plot(meq, pch = 16, cex = 0.7)
# dev.off();
Please follow to Getting started with Matrix eQTL for information on how to apply Matrix eQTL to your own data.